
A more rigorous look at visualization
Stat 221, Lecture 5
Lecture plan
- Intro: statistics + data science
- Information visualization
- Breadth of the infovis phenomenon.
- Infovis analysis framework.
- Tools to create visualization.
- Critiquing visualizations.
Statistics + data sciece
- Rachel Schutt: data science as a set of skills.
- Statistics skills intersected with data science.
- Blog to cover the class harvarddatascience.com:
- Visualization and analytic methods critiques.
- T-Shirt competitions.
- Class lecture comments and materials.
- Final projects.
- Student contributions.
Information visualization

- What is it? (vis. by Casey Reas)
And what is this?
Scale of the visualization movement
Let's think about what defines an infovis
Some examples of visualizations
More examples
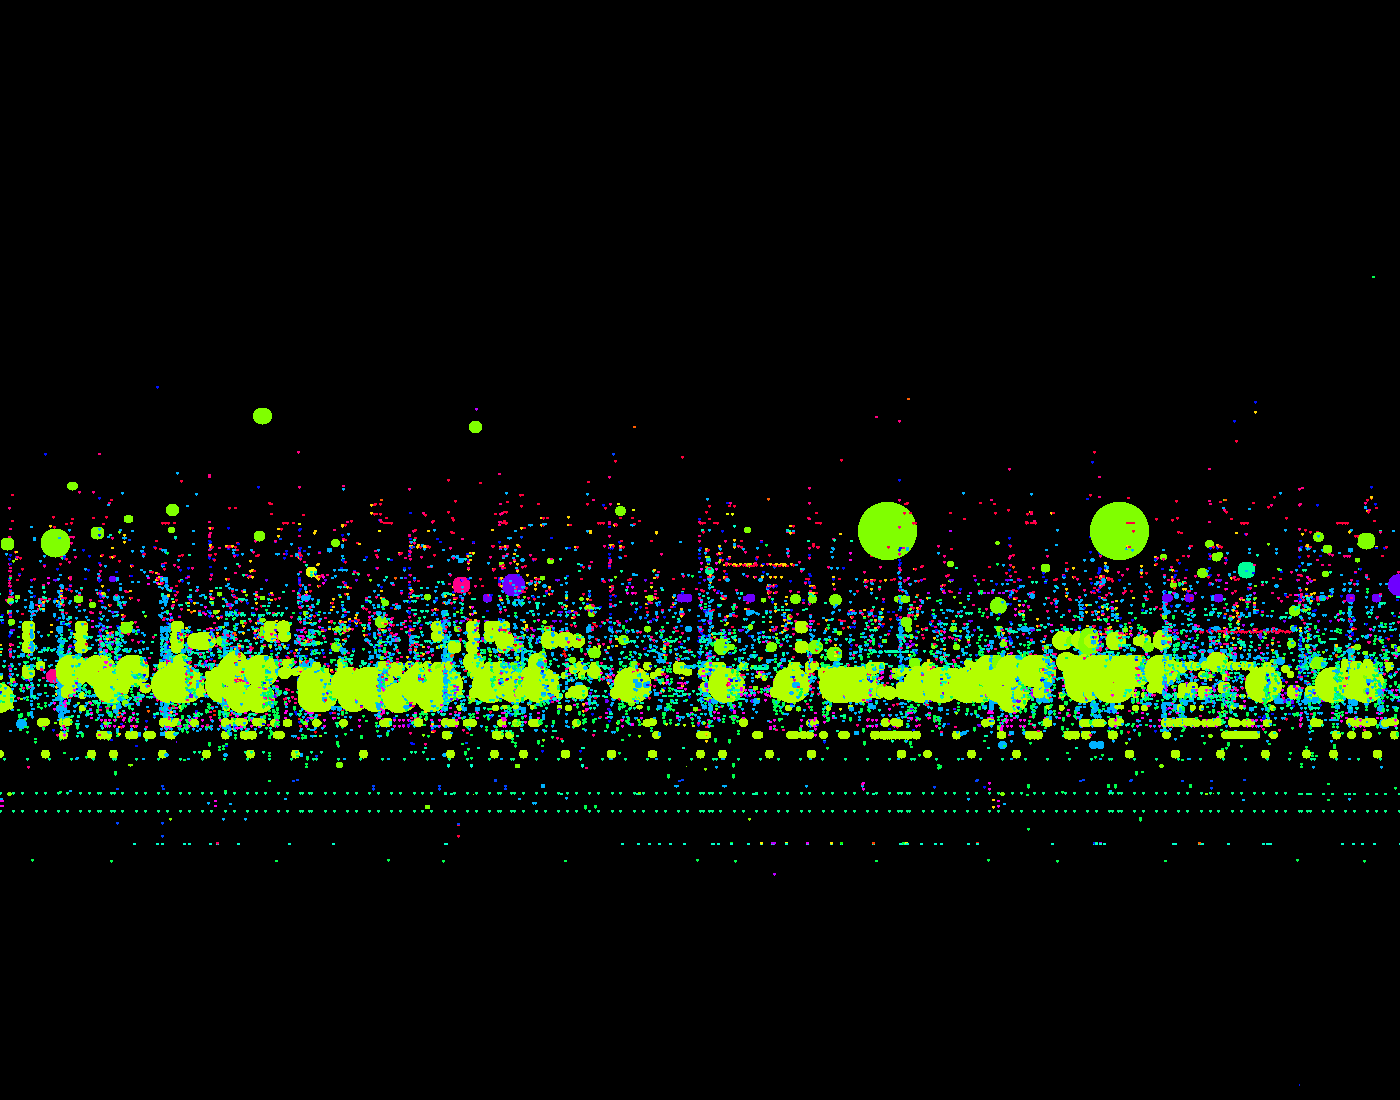
More examples

More examples
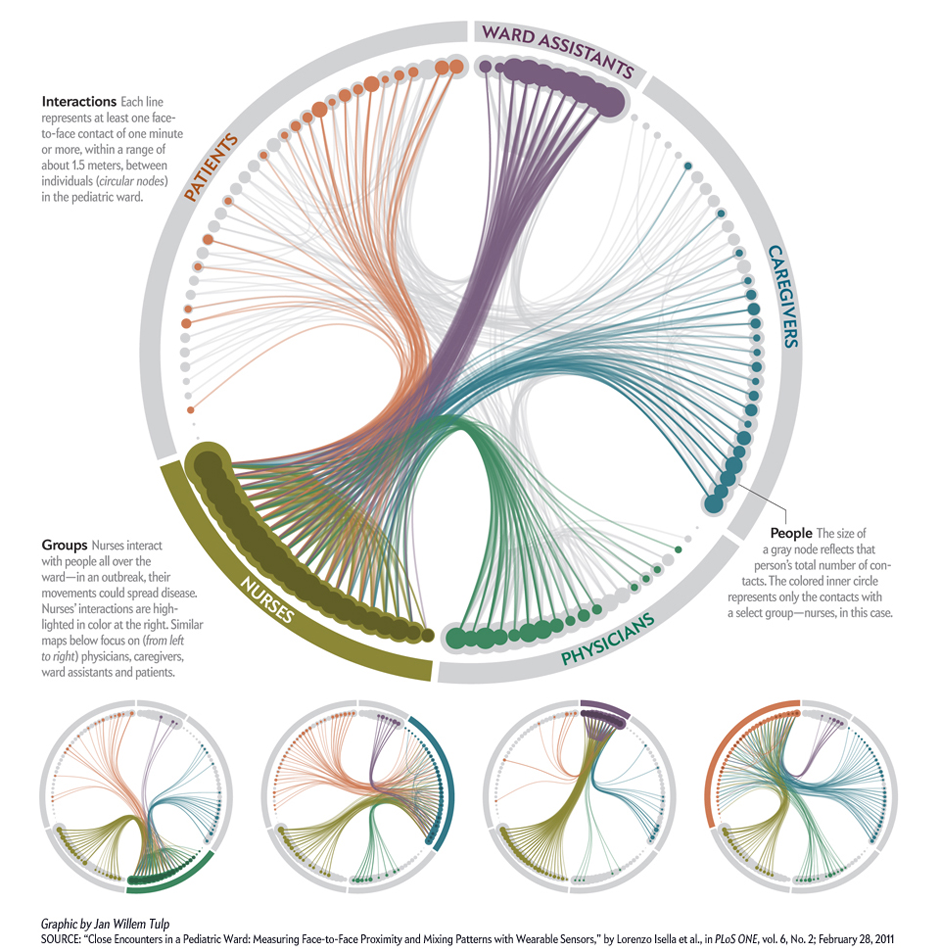
A large variety
- All visualizations convey inromation. But not all do it well.
- Visualization signal-to-noise ratio is varied.
What are the main concepts that can serve as basis points when defining a visualization?
Visualization: defining traits
- The goal (convey a message, engage, entertain, perplex).
- The audience.
- Type (system mechanics, information summary, generative application)
Visualization type
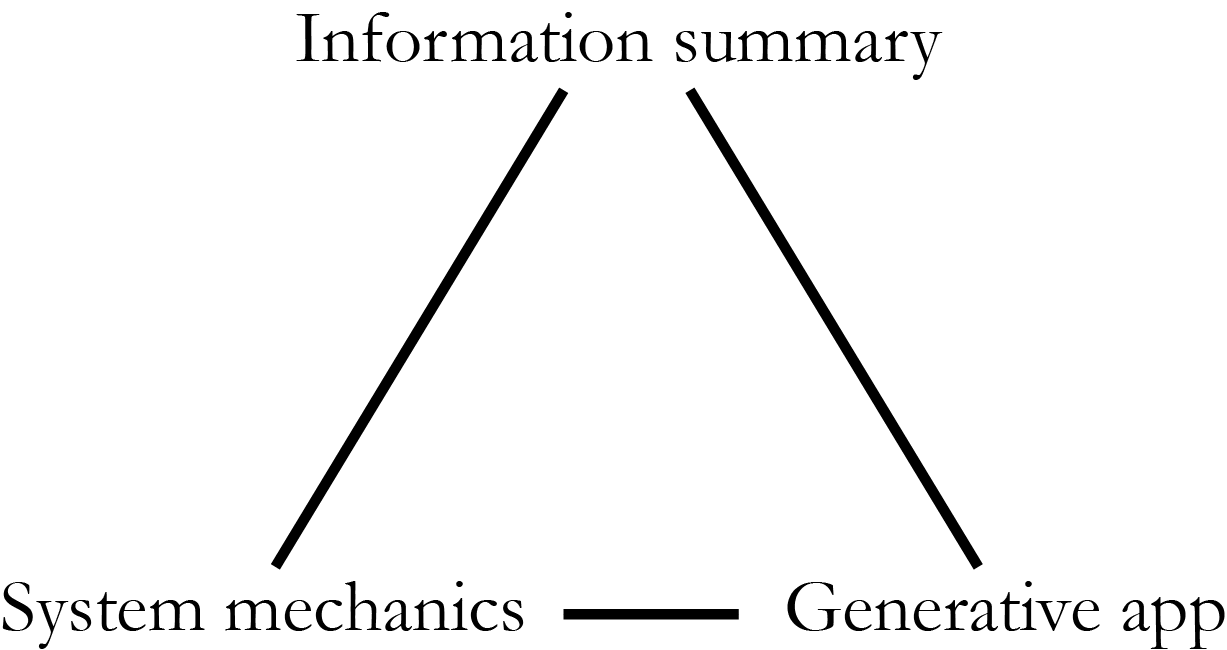
Gen. app + sys. mechanics example

Classifying a visualization
Class activity:
Visualization tradeoffs
- Subject to the goal.
- Color, number of shapes, control elements versus understanding (signal-to-noise).
- Implementation language-specific programming tradeoffs.
Stat visualization
- Gelman: "Within statistics, exploratory and graphical methods represent a minor subfield and are not well- integrated with larger themes of modeling and inference. Outside of statistics, infographics (also called information visualization or Infovis) is huge, but their purveyors and enthusiasts appear largely to be uninterested in statistical principles."
- Gelman, Andrew, and Antony Unwin. "Infovis and Statistical Graphics: Different Goals, Different Looks." (2011).
Statistical visualization
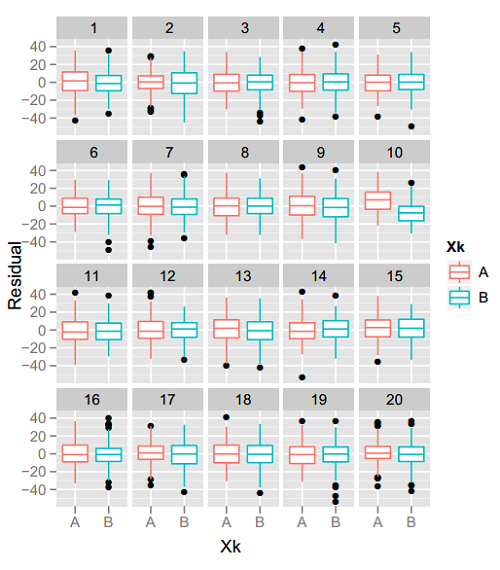
Stat visualization
- Papers.
- Talks, quick research sketching.
- Teaching.
- Rarely display findings to the general public.
- Type: most often information summary.
- What is the audience? What is the goal?
Infovis + statistics
NBA scoring spots on the New York Times
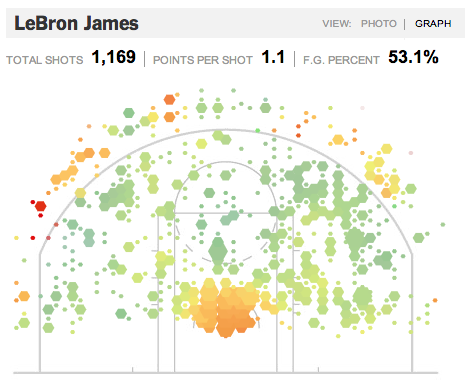
Advanced statistical uses of infovis
- Non-parametric inference (with caveats).
- Powerful help in method design - system mechanics, model diagnostics.
- Generative app use - fitting nuisance parameters, or even complete models.
- Educational use.
Tools to create Infovis
- R (native, ggplot)
- Javascript (d3.js, Paper.js, Three.js, Processing.js, Raphael etc)
- Flash
- Java (Processing)
- C++ (Cinder)
How d3js works - overview
// initialize the SVG container
var con = d3.select("#" + container)
            .insert("div", ":first-child")
            .attr('class', 'ivcont');
// add visualization title
con.append("h2").html(title);- Manipulates DOM elements of the HTML page.
- Associates elements of data arrays with similar elements on the plot.
- Can be styled with CSS.
- Different from Paper.js, Processing.js.
- Extensively described with examples on the Web.
Things to consider
Several aspects are important when creating a visualization:
- Goal. What are you trying to achieve with the project?
- Audience. Who are you trying to capture?
- Visualization type.
- Colors, shapes, transition speeds.
- The principle of parsimony.
Stat concentration v1
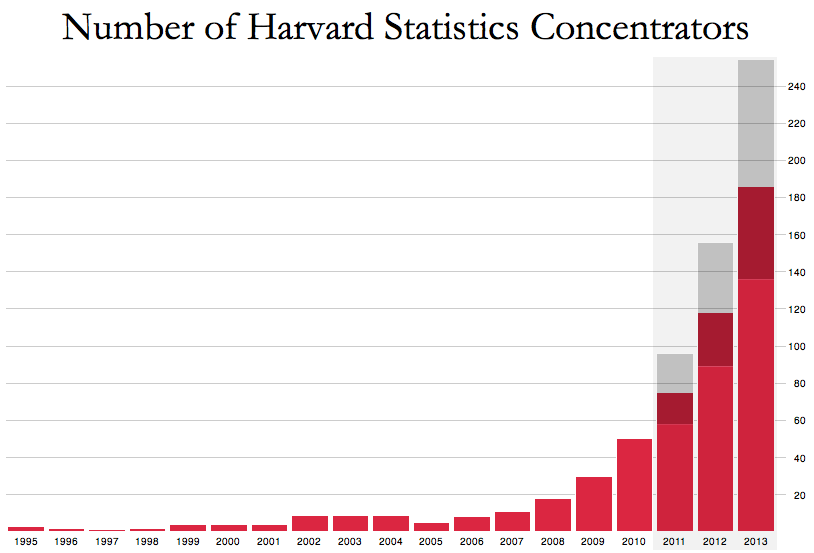
Stat concentration v2
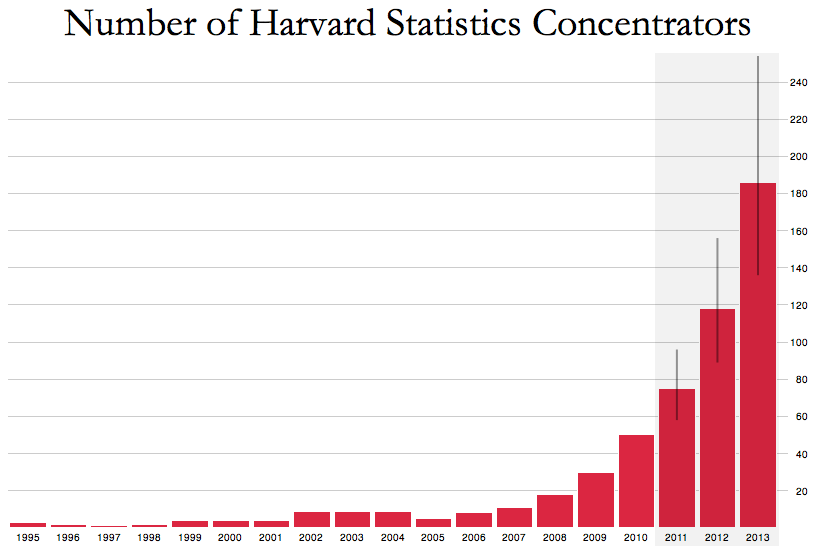
Stat concentration v3
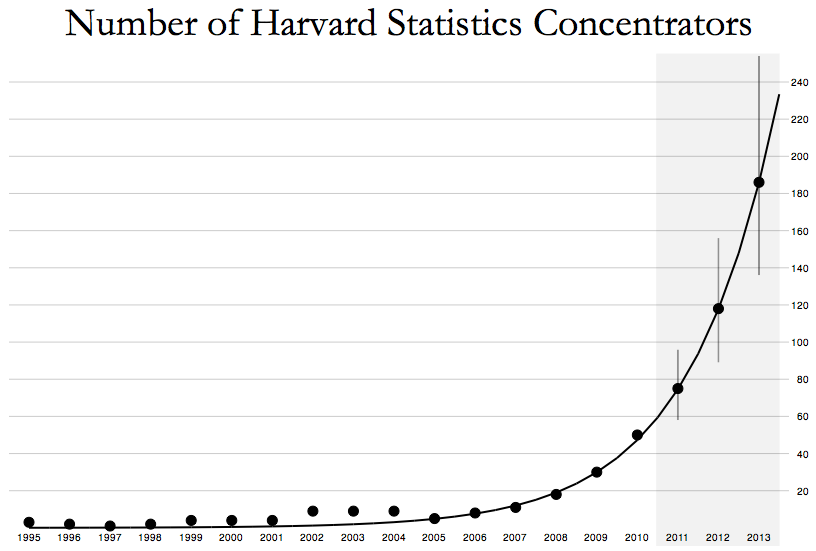
Critiquing a visualization
Announcements
- Final project team assignment February 17.
- Must have Odyssey access for Problem Set 2.
- d3js workshop Wednesdays.
Resources
- Slides nesterko.com/lectures/stat221-2012/lecture5
- Class website theory.info/harvardstat221
- Class Piazza piazza.com/class#spring2013/stat221
- Class Twitter twitter.com/harvardstat221
Final slide
- Next lecture: Statistical models + Likelihood
- Special guest appearance - Arman Sabbaghi.