
Course introduction
Stat 221, Lecture 1
Brief facts about the class
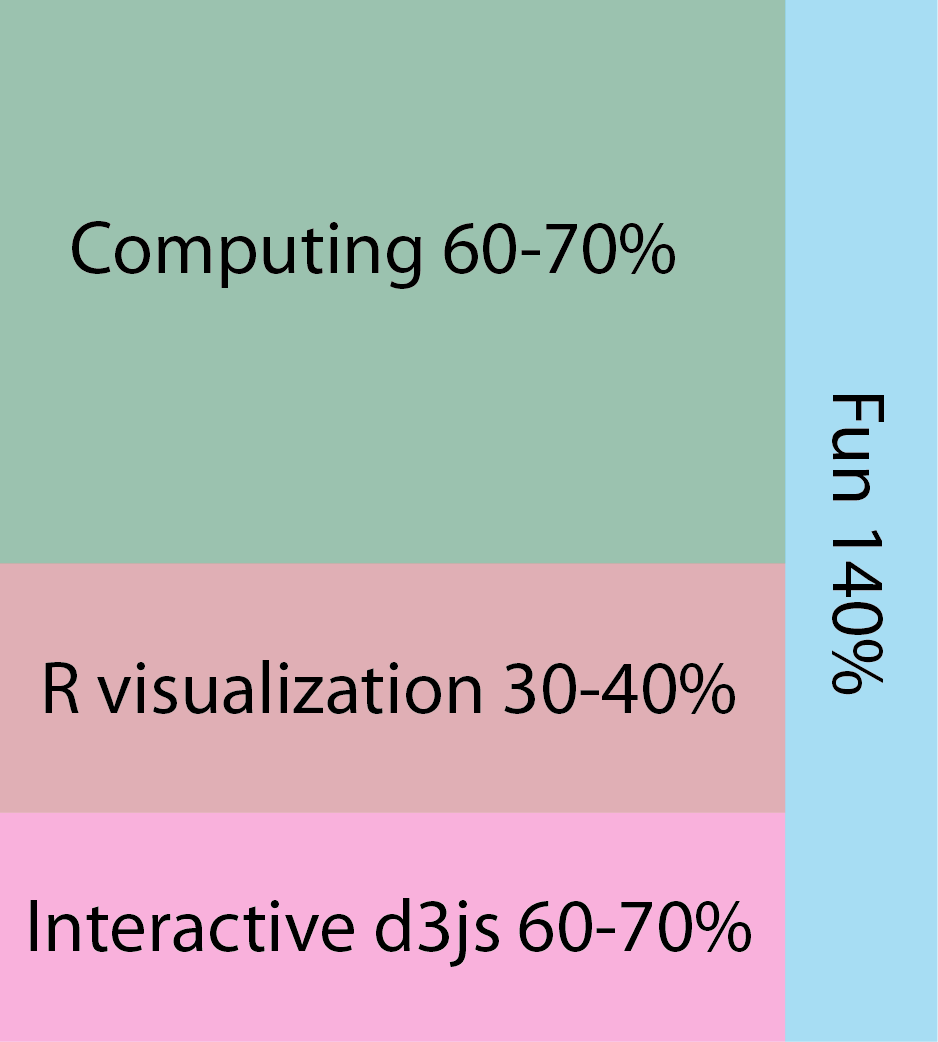
- Connects computing, modeling, and presentation
- Cloud computing on Odyssey
- Efficient coding of algorithms in R - ML, EM, HMC etc.
- Interactive visualization using d3.js
- Emphasis on the final project
Student introductions - 5 minutes
- Why the class is great
- What is your background and why you are interested in the class
Why the class is great
- Connects the many aspects of data analysis
- Highlights the tradeoffs and balances that one needs to strike
- Practical, useful tools
- Rigorous
- Exciting and unique
Example - Siemens challenge
- Final project possibility.
- New cardiac healthcare product piloting in India.
- Create models to simulate competitor response dynamics and optimize pricing strategy.
Prerequisites
- Stat 110/111 or equivalent for basic statistical knowledge.
- Linear algebra for understanding vectorization in R.
- Ability to use R.
A student would benefit from expanded knowledge of statistics on the graduate level and extended programming experience to be able to focus on the main features.
Registered students and auditors
Registered students:
- Get to come to lectures, work on problem sets.
- Get feedback from teaching staff.
- Get to work on the final project with the guidance of the teaching staff and in communication with the assigned partner or collaborator.
Auditors:
- Get to come to lectures, work on problem sets.
Problem set structure
Code snippets.
Lectures structure
- Conceptual material.
- Theoretic derivations.
- Examples, guest appearances.
- Discussion.
Grading
- 10% participation, 55% homework, 35% final project
- Participation: t-shirt comps, infopieces, lecture, Piazza, d3js.
- Pass/fail for undergraduates option.
- Letter graded for graduate students.
Parallel tempering illustration example

Other visualizations
- On the class website.
Interactive visualization
- Each homework will contain a component for interactive visualization.
- Interactive visualization is optional - it is possible to get 100% without creating a single interactive visualization.
- However, electing to work on d3 exercises will give many extra points that roll over from homework to homework.
Typical workflow
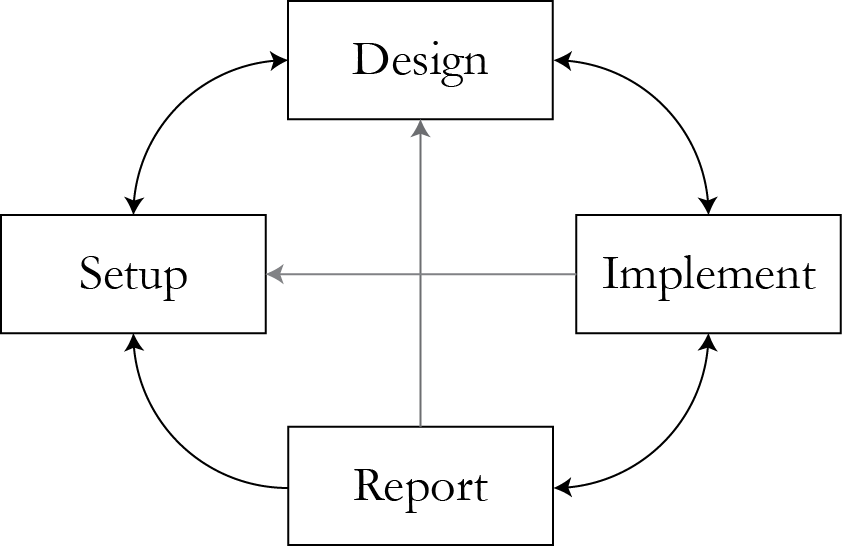
Workflow stages
- Setup: talk to collaborator/client, get the data, understand the question of interest.
- Design: an analytic method for a solution, evaluate its properties and assumptions.
- Implement: a working, practical computing solution to perform the designed procedure.
- Report: the findings, help understand and interpret them. Advise on the method's applicability for repeated use.
Stat 221 covers the entire workflow
Emphasis on:
- Implementation of computational methods - problem sets, final project.
- Interactive visualization for design and communication - problem sets, final project.
- Initial and final communication with collaborator/client - via final project.
- The final projects will be quite exciting.
Stat 221 and research
- Computing techniques are directly related to open research questions.
- Final projects that can result in thesis chapters.
- Problem sets can inspire original research.
- The considered practical tools feed directly into the ability to do better quantitative research.
Stat 221 and intuition building
Data analysis is abundant with tradeoffs and balances one needs to strike:
- Computing tradeoffs
- Statistical modeling and inference tradeoffs
- Interactive visualization tradeoffs
Stat 221 and practical skills
We will cover a range of programming and computing skills that can be useful in a generic setting:
- Writing quick and efficient code in R.
- Introduction to cloud computing and MPI.
- Creating interactive visualizations with d3.js (optional) using Javascript/CSS/HTML.
- Communicating effectively with non-statistician collaborators to solve important problems together.
Assignments structure
- 5 problem sets, 1 final project.
- No exams.
- Odyssey work starts with the second problem set.
Final project
- Your own research computing/visualization project
- Or, choose from academic and industry projects


Final projects are cool
- High-impact data-driven problems.
- Direct communication with collaborators: companies' representatives or faculty.
- Cover the entire cycle of the data analysis workflow.
Final project examples
- Siemens: simulate and visualize potential market dynamics for a new industry-changing healthcare product in India.
- IBM: optimize budget allocations for increased effectiveness of public agencies in the US.
- MIT: study viability of sustainability ("green") initiatives on the example of a major airline.
- Harvard: Study the connection between homophily-induced network community structure and conventional community detection algorithms.
Final projects structure
- Students rank their preferences to final projects starting Feb. 4.
- Student teams of up to 4-5 people are assigned to final projects by Feb. 17.
- Final project work continues through Feb. 17-Apr. 29.
- Final project presentations end of semester.
Resources
- Slides nesterko.com/lectures/stat221-2012/lecture1
- Class website theory.info/harvardstat221
- Class Piazza piazza.com/harvard/spring2013/stat221/home
- Class Twitter twitter.com/harvardstat221
Course memorabilia

There will be competitions with free shirts as prizes.
Announcement
- Tristan Zajonc from Sense to talk on Jan. 30 in CGIS 354
Final slide
- Next lecture: Introduction to data Visualization + statistical Modeling + Computing (VMC) I
- Don't hesitate to talk to course staff about the class and your specific needs.
- Happy Spring semester!